🟡 CO oxidation (codim 2)
The goal of the tutorial is to show a simple example of how to perform codimension 2 bifurcation detection.
In this tutorial, we study the Bykov–Yablonskii–Kim model of CO oxidation (see [Govaerts]):
\[\left\{\begin{array}{l}\dot{x}=2 q_{1} z^{2}-2 q_{5} x^{2}-q_{3} x y \\ \dot{y}=q_{2} z-q_{6} y-q_{3} x y \\ \dot{s}=q_{4} z-k q_{4} s\end{array}\right.\tag{E}\]
where $z=1-x-y-s$.
We start with some imports:
using Revise, Plotsimport BifurcationKit as BKimport BifurcationKit: @optic, @set, norminfProblem setting
We encode the vector field (E) in a function.
# vector field of the problemfunction COm(u, p) (;q1,q2,q3,q4,q5,q6,k) = p x, y, s = u z = 1-x-y-s [ 2q1 * z^2 - 2q5 * x^2 - q3 * x * y, q2 * z - q6 * y - q3 * x * y, q4 * z - k * q4 * s ]end# parameters used in the modelpar_com = (q1 = 2.5, q2 = 0.6, q3 = 10., q4 = 0.0675, q5 = 1., q6 = 0.1, k = 0.4)recordCO(x, p; k...) = (x = x[1], y = x[2], s = x[3])# initial conditionz0 = [0.07, 0.2, 05]# Bifurcation Problemprob = BK.ODEBifProblem(COm, z0, par_com, (@optic _.q2); record_from_solution = recordCO)Continuation and codim 1 bifurcations
Once the problem is set up, we can continue the state w.r.t. $q_2$ and detect codim 1 bifurcations. This is achieved as follows:
# continuation parametersopts_br = BK.ContinuationPar(p_max = 1.9, dsmax = 0.01)# compute the branch of solutionsbr = BK.continuation(prob, BK.PALC(), opts_br; normC = norminf) ┌─ Curve type: EquilibriumCont
├─ Number of points: 115
├─ Type of vectors: Vector{Float64}
├─ Parameter q2 starts at 0.6, ends at 1.9
├─ Algo: PALC [Secant]
└─ Special points:
- # 1, hopf at q2 ≈ +1.04100305 ∈ (+1.04089208, +1.04100305), |δp|=1e-04, [converged], δ = ( 2, 2), step = 34
- # 2, bp at q2 ≈ +1.05220009 ∈ (+1.05219197, +1.05220009), |δp|=8e-06, [converged], δ = (-1, 0), step = 38
- # 3, bp at q2 ≈ +1.04204852 ∈ (+1.04204852, +1.04204887), |δp|=3e-07, [converged], δ = ( 1, 0), step = 46
- # 4, hopf at q2 ≈ +1.05218722 ∈ (+1.05080930, +1.05218722), |δp|=1e-03, [converged], δ = (-2, -2), step = 50
- # 5, endpoint at q2 ≈ +1.90000000, step = 114
# plot the branchscene = plot(br, xlims = (0.8, 1.8))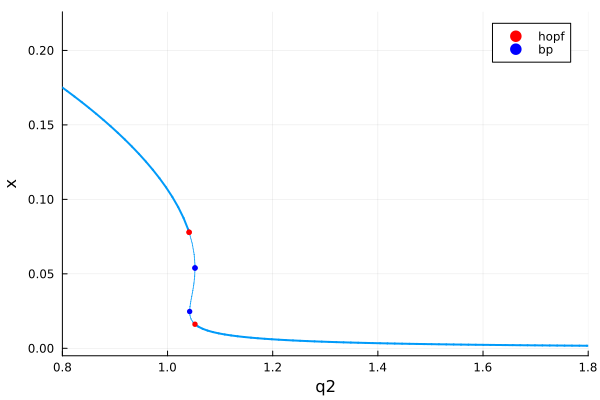
Locus of Fold points as function $k$
If we vary the parameter $k$, the previous bifurcation points changes. Let us compute branches for different values of $k$.
_branches = [BK.continuation(BK.re_make(prob, params = @set par_com.k = k),
				 BK.PALC(), BK.ContinuationPar(opts_br, p_min = 0.6, p_max = 1.5);
				normC = norminf,
				bothside = true)
			for k in LinRange(0.4, 0.45, 60)
				];
plot()
for b in _branches
	plot!(fill(BK.getparams(b).k,length(b)), b.param, b.x, label = "", color = :blue)
	for pb in b.specialpoint
		if pb.type in (:hopf, :bp)
			col = pb.type == :hopf ? :red : :blue
			scatter!([BK.getparams(b).k], [pb.param], [pb.printsol.x], label = "", color = col)
		end
	end
end
xlabel!("k"); ylabel!("q2");zlabel!("x")
title!("")
This is cumbersome and inefficient. We can in fact directly follow the Hopf / Fold points as function of two parameters.
Continuation of Fold points
We follow the Fold points in the parameter plane $(q_2, k)$. We tell the solver to consider br.specialpoint[2] and continue it.
sn_codim2 = BK.continuation(br, 2, (@optic _.k), BK.ContinuationPar(opts_br, p_max = 2.2, ds = -0.001, dsmax = 0.05); normC = norminf, # compute both sides of the initial condition bothside = true, # detection of codim 2 bifurcations detect_codim2_bifurcation = 2, )scene = plot(sn_codim2, vars = (:q2, :x), branchlabel = "Fold")plot!(scene, br, xlims=(0.8, 1.8))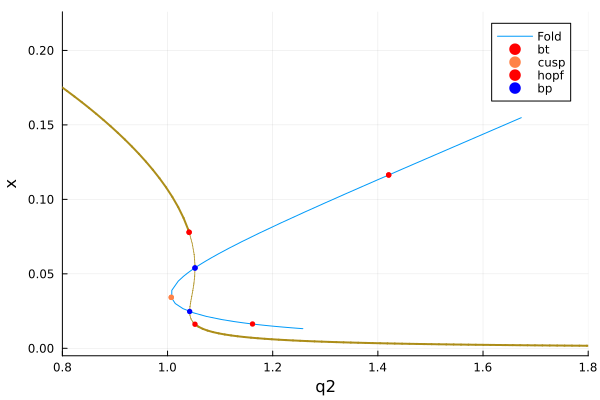
Continuation of Hopf points
We tell the solver to consider br.specialpoint[1] and continue it.
hp_codim2 = BK.continuation(br, 1, (@optic _.k), BK.ContinuationPar(opts_br, p_max = 2.8, ds = -0.001, dsmax = 0.025) ; normC = norminf, # detection of codim 2 bifurcations detect_codim2_bifurcation = 2, # compute both sides of the initial condition bothside = true, )# plottingscene = plot(sn_codim2, vars = (:q2, :x), branchlabel = "Fold")plot!(scene, hp_codim2, vars = (:q2, :x), branchlabel = "Hopf")plot!(scene, br, xlims = (0.6, 1.5))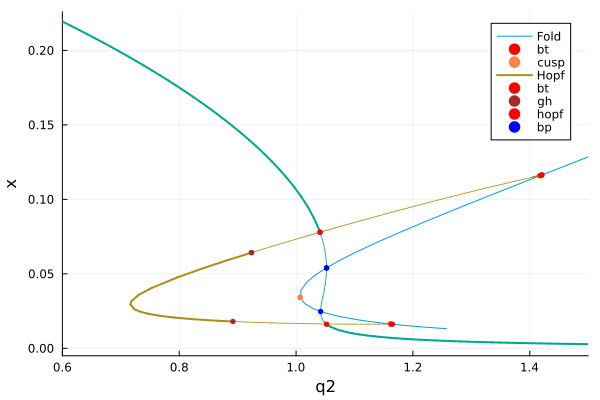
References
- Govaerts
Govaerts, Willy J. F. Numerical Methods for Bifurcations of Dynamical Equilibria. Philadelphia, Pa: Society for Industrial and Applied Mathematics, 2000.